
Analytics


This quick video provides an overview of ProSight’s analytics dashboard and how it shows revenue, payment methods, and usage trends without a custom report.
How do agencies see service performance in ProSight?
What it does: ProSight’s analytics dashboard shows how agency services are performing without waiting on a custom report or pulling data manually.
What it shows: revenue collected over a selected date range, payments broken down by method, and trend data over time. The Usage tab shows resident registrations, login activity, and app downloads by platform. Each user sees only the data for the services and tenants they have access to.
Related Videos
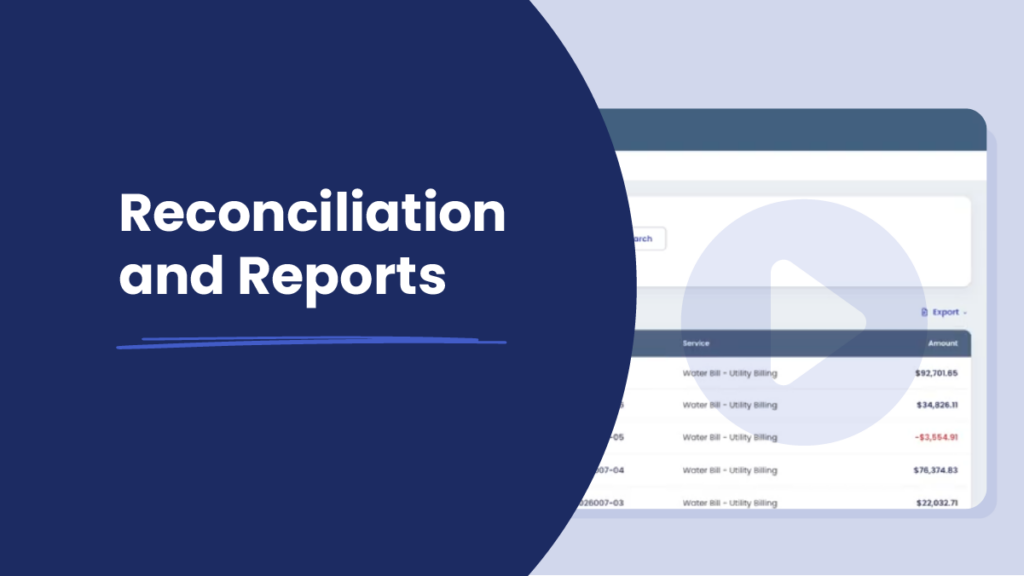
Demo Video
0:55 mins – Agency Experience
Reconciliation & Reports
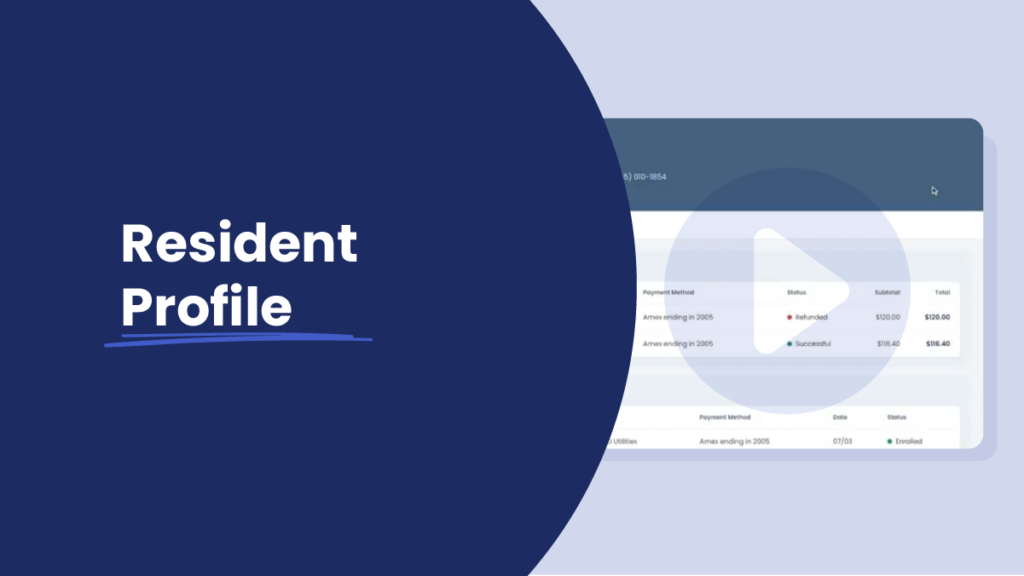
Demo Video
0:46 mins – Agency Experience
Resident Profile
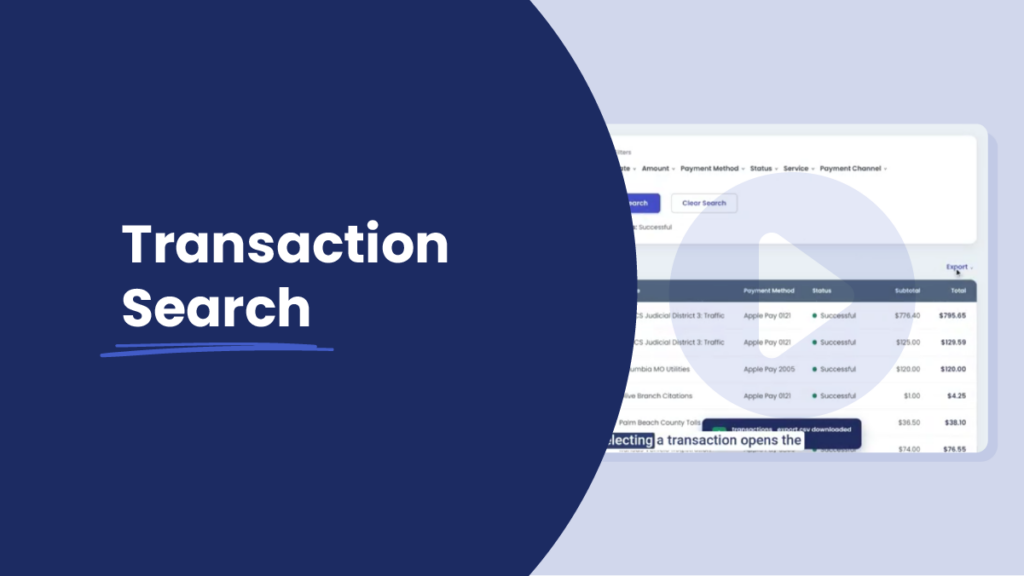
Demo Video
0:43 mins – Agency Experience
Transaction Search
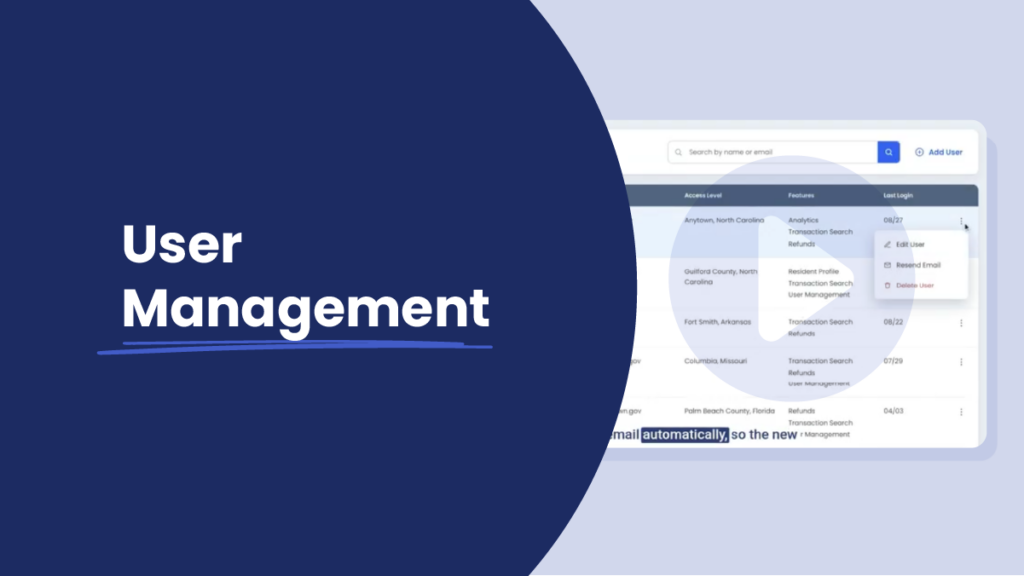
Demo Video
0:46 mins – Agency Experience